


There’s an accelerating shift away from paper charts, but how best to use predicted data from digital aids in real-world situations? Craig Burton, head of training operations at the Royal Yachting Association (RYA) shares his advice.
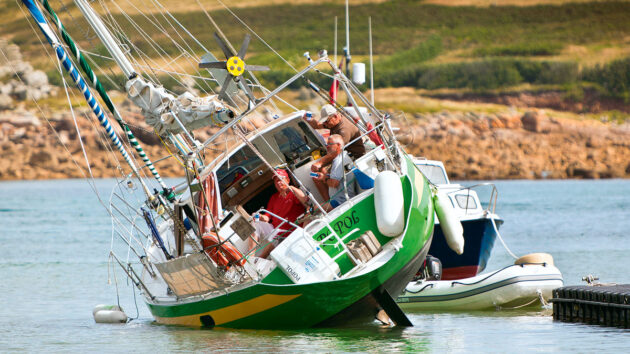
Globally, digital navigation is the primary means of navigation for skippers and navigators.
This shift from paper charts has exposed limitations in official electronic navigation charts (ENCs) for leisure use because, while private providers have helped fill gaps, key issues remain around display systems, backup arrangements, training, and cost.
Paper charts remain the only viable official source of chart data, as there is not yet an approved electronic system suitable for most leisure craft.
Yet, in two recent RYA surveys, the vast majority of 4,000 respondents per survey stated that they used digital navigational equipment as their primary passage-making navigational tools.
Digital aids can take the hard work out of passage planning and monitoring, and enhance accuracy but it’s important to be confident that the primary sources of raw data is accurate.
Where in the world?
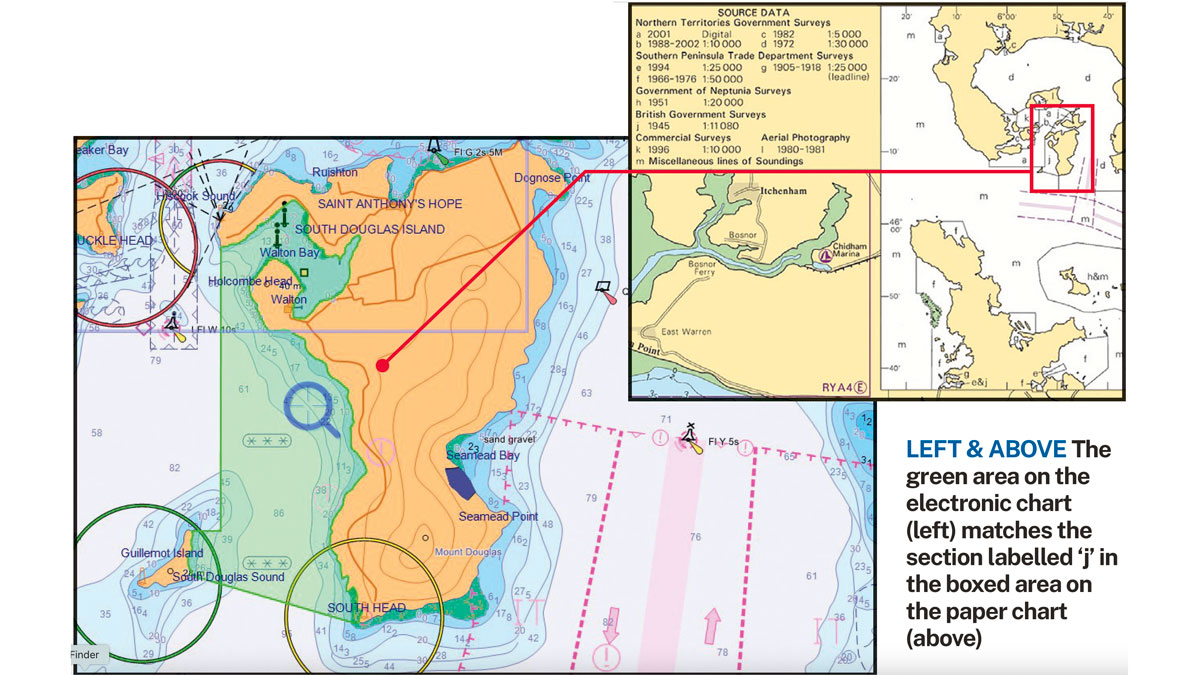
The green area on the electronic chart (left) matches the section labelled ‘j’ in the boxed area on the paper chart (above). Credit: RYA
This is equally true of our horizontal position.
Now we can accurately plot our position using satellites, the reliability of the electronic charts we are using becomes crucial.
We need to know how accurately placed a rock might be if we are navigating to a tolerance of metres rather that hundreds of yards.
In the paper-plotting world, we used pilotage at close quarters, in which case our position, relative to fixed objects and charted navigation marks, could be transferred to the chart with an accuracy that had more to do with the competence of the navigator than the skill of the hydrographer and his surveys.
When far offshore, dead reckoning (DR), astro and estimated positions (EPs) are used when considerable margins for error had to be factored in and the accuracy of charts was not generally an issue.
The arrival of global navigation satellite system (GNSS) receivers suddenly threw the accuracy of charts, and the information they were based on, into sharp focus.
Augmented GNSS can now give positions accurate to less than 1m. But what happens when you transfer that position onto a chart?
The first problem was that paper charts from different countries and hydrographic offices used slightly different models for the shape of the earth – horizontal datums.
The UK Hydrographic Office (UKHO) used its own datum, OSGB1936.
Internationally, one of the most popular was WGS84 and this was adopted as the standard for GPS navigation. Positions arrived at by the two different systems could be different to a significant degree.
In the early days of GPS, corrections had to be applied to WGS84-derived positions to be able to plot them on OSGB36-based UKHO charts.
The difference was enough to worry conscientious navigators.
Today charts are published using a horizontal datum compatible with WGS84 positions.
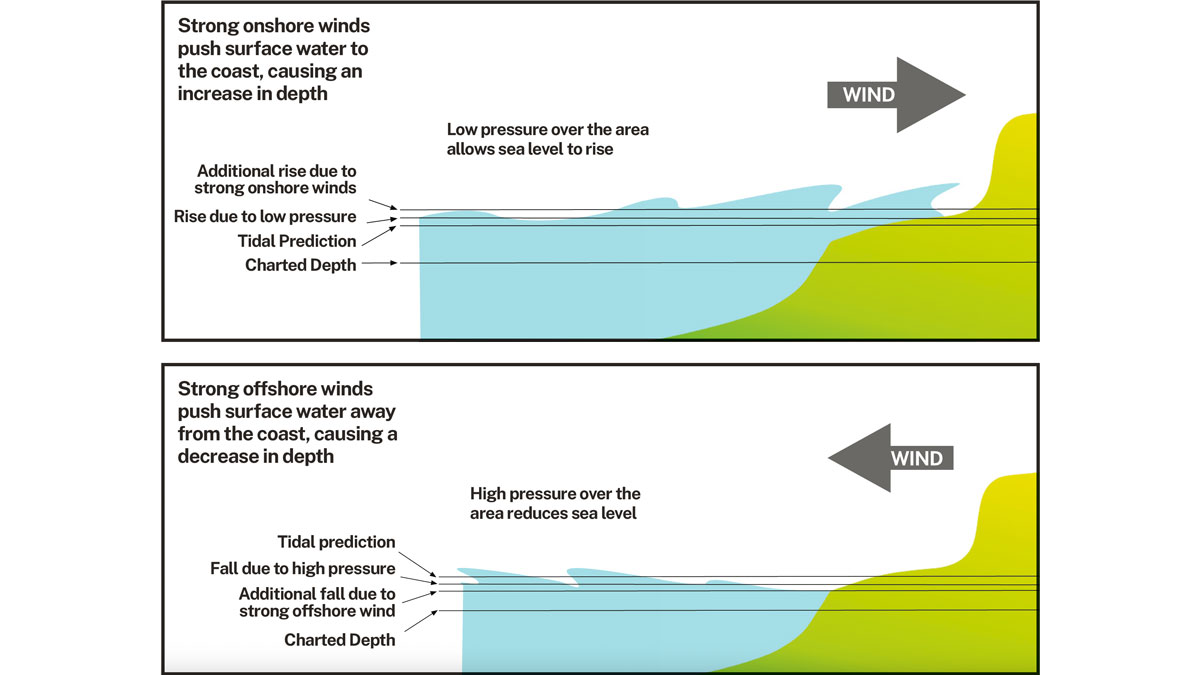
Diagram showing the effect of onshore and offshore winds on sea level. Credit: RYA
Reliability of electronic charts
But what if the survey on which the paper chart, and the electronic chart derived from it, is inaccurate?
In the traditional world of pilotage this doesn’t generally matter.
In the digital world it really does, because you may know exactly where you are in the world but the cartographer may not have exactly identified where the land is.
In most well-travelled parts of the ocean, a combination of modern hydrographic and satellite surveys has developed charts accurate enough for all practical purposes, but it’s still good to know just how accurate the information is.
Data comparison
On a paper chart this information will be printed in a source data table like that in the illustration (opposite).
It indicates that part of the chart was drawn from a government survey dating from 1945 (marked ‘j’, in the red boxed area) which might be considered unreliable by modern standards.
The digital vector chart next to it has a note giving a zone of confidence of Grade C, meaning positional accuracy is within +/- 500m and depths up to 10m may be incorrect to +/- 2.5m. Definitely unreliable!
Unfortunately, most commercially available digital charts for the leisure industry do not give a ‘quality of data’ measure.
An example of the risks of relying on such data is the grounding and loss of the Cork Clipper in the Java Sea due to the charted position of a reef being 0.9 miles out.
The most accurate chart surveys (graded as A1) have a positional accuracy of +/- 5m and depth accuracy of +/- 0.6m, for charted depths up to 10m.
The next grade down (A2) has positional accuracy of +/- 20m and charted depths of +/- 1.2m for depths up to 10m.
Pilotage basics
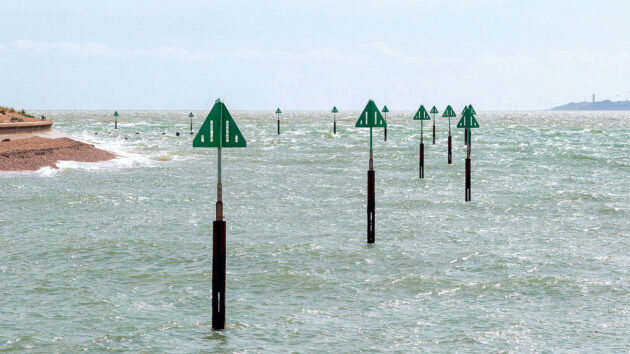
Don’t ignore information from real-world data when navigating by electronic charts. Credit: geogphotos/Alamy
By the third grade (B) of six we find positional accuracy as +/- 50m. It’s estimated the average accuracy of chart data is +/- 60m.
In this digital world there is still a need to make use of all pilotage and planning techniques.
The only difference is that most sailors will be using these to check the digital information.
When entering a small harbour, you’d be foolish not to use the buoyage, transits or sector lights provided.
Then, even if the electronic chart survey is out by 500m, you’ll be safe if you stay in the channel.
At close quarters, it’s your position relative to dangers or safe areas that’s important, not an electronically derived lat/long position. This is essentially what pilotage is all about.
‘Digital First’ navigation means using electronics for more efficient passage planning and execution, but we must remember that the human is always in charge.
If the electronics are not providing what you need, switch to plan ‘B’ – which, at the moment, is still paper charts.
Predicted vs real tidal data study
In the pre-digital age, there were trusted sources of printed tidal information.
There’s a greater choice now, however it is worth checking the reliability of the source of data on digital tidal prediction apps and websites to compare predicted heights and rates of flow with actual data.
The best source for predictions in the UK is the UKHO, which is the national entity chosen to provide this information for the safety of shipping.
We compared predicted height for Southampton Water at 14:30 on easytide.admiralty.co.uk (3.8m) with the actual tidal height gauge reading (4.0m).
Other sites showed 4.0m, 3.9m and 3.8m.
You may think the source matching the actual height is best but repeat this exercise on different occasions and other sources will prove more accurate.
No matter how clever a tidal height prediction is there can still be a variance of 20-30cm due to changes in air pressure alone.
Adding the effect of wind direction and strength can affect tidal height by up to 0.9m (storm surges).
A good navigator will build in a margin of safety.
Paper reprise
- July 2022: UKHO announces its intention to cease production of Standard Nautical Charts and Thematic Charts by late 2026.
- February 2023: Following public outcry, the UKHO pledges to continue the service until 2030.
- November 2024: UK’s leading publisher for leisure sailors Imray, Laurie Norie & Wilson announces plans to cease publication of new paper charts in late 2025.
- April 2025: A U-turn on Imray’s decision is confirmed thanks to a merger with Austrian cartographic specialist freytag & berndt.
- February 2026: UKHO announces that it has developed a more efficient way to print nautical paper charts on demand, using electronic chart data.
- Future: Paper charts will continue as long as people are buying them.
About the author

Craig Burton is head of training operations at the Royal Yachting Association (RYA)
PBO’s new eNav in a Nutshell series is supported by Navimaps.co.uk – experts in marine cartography – Navionics & Garmin Navionics for chartplotters.
What to read more features like Paper charts versus electronic charts?
A subscription to Practical Boat Owner magazine costs around 40% less than the cover price.
Print and digital editions are available through Magazines Direct – where you can also find the latest deals.
PBO is packed with information to help you get the most from boat ownership – whether sail or power.
-
-
-
- Take your DIY skills to the next level with trusted advice on boat maintenance and repairs
- Impartial, in-depth gear reviews
- Practical cruising tips for making the most of your time afloat
-
-
Follow us on Facebook, Instagram, TikTok and X