Up-to-date printed paper charts are a good bet for identifying your position – but they do have their limits, says Dick Everitt
Ever since early Spanish cartographers distorted maps of the world to give Spain more influence, mariners have viewed charts with a degree of scepticism.
Luckily for us, in 1569 the Belgian map maker Mercator distorted the world to suit his projection which makes the latitude and longitude grid run parallel to the edges of the chart. This allows us to draw a simple straight line course, known as a rhumb line, which cuts all the meridians at the same angle. This angle is then used as the basis of our ‘course to steer’ calculations.
To measure distances we have to use the latitude scale which runs up the edge of the chart (because one nautical mile equals one minute of latitude). But as the Mercator scale gradually expands going north we must only use the graduations that are roughly in line with our position.
A good exercise for new navigators that fi nd it hard to read off an ‘accurate lat and long position’ is to work out the positions of the tidal diamonds that are dotted around the chart, because their correct coordinates are always tabulated somewhere on the chart.
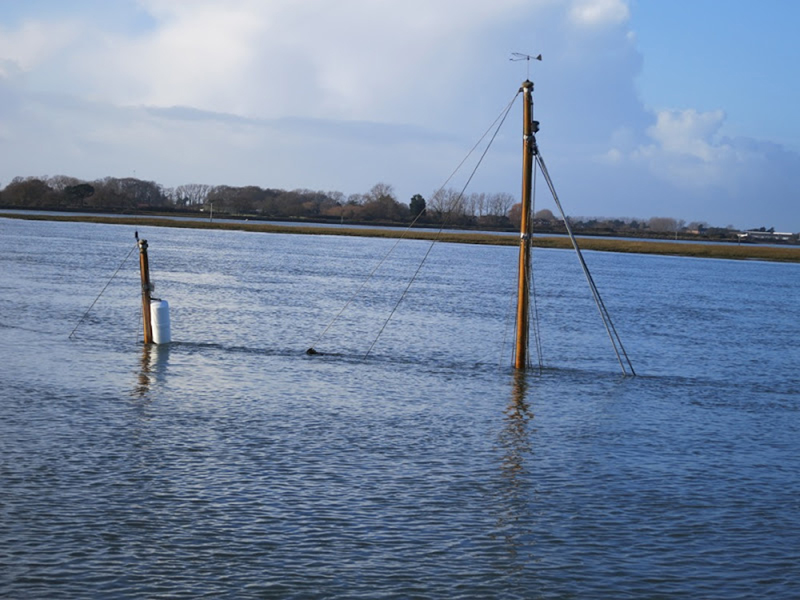
Ideally charts should be up to date, but in the real world they usually aren’t. A buoy could have sunk just before we got there, or more normally we haven’t kept up with all the chart corrections.
It makes sense to check the latest Notices to Mariners at www.ukho.gov.uk, and where there have been substantial changes they even provide patches that we can print off and stick on our charts.
But do make sure your printer is set up correctly, otherwise they won’t line up properly. Mind you, if you’re feeling very flush you can always buy new charts each season but do check the correction dates written along the bottom edge of the chart.
Survey dates are also worth noting because in some remote areas the survey could have last been done in 1800s, or indeed an area might never have been surveyed at all. Airborne lasers are now supplementing sonar surveys, but these flights are limited by financial and technical constraints.
Nothing to break down
I love paper charts because they keep working even when the world around you is going wrong: they don’t need battery power, they’re big (so details are clear and it’s easy to get an overview of where to divert to), you can scribble notes on them and they don’t mind the odd dollop of water.
They are expensive when compared to some electronic charts, though. Maybe a budget solution is to run along your route on a PC with a £30 DVD of 800 new UKHO charts, and transfer major changes to second-hand paper ones. You can often find these online, or there’s a great RNLI charity stall at Beaulieu BoatJumble where you can buy whole folios for a fraction of their original cost.
Ideally, get WGS84 datum ones so you can plot GPS positions directly, and if you supplement them with a few new charts, an up-to-date list of lights and some local knowledge gleaned from the internet, an experienced navigator should be OK.
One old sea captain I know also carries Ordnance Survey maps because they depict handy landmarks, such as mountains and caravan sites, better than charts. But he did admit to working into a remote anchorage in fog, and what he thought was his handy caravan site were a few white rocks on the beach!
Crossing oceans
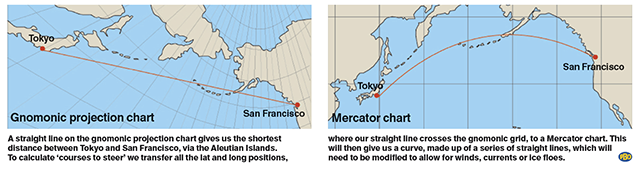
At the other end of the scale, if we want to sail across an ocean we need to have a look at a gnomonic projection chart, which has a curved latitude and longitude grid.
Drawing a straight line on this gives us the shortest distance between two points on the earth’s surface, known as a great circle route (think of cutting an orange through its centre and the arc of the cut skin is our route).
To calculate ‘courses to steer’ we need to transfer all the positions where our straight line crosses the curved Gnomonic grid, to a Mercator chart.
This will then give us a curve made up of a series of straight lines, but we’ll need to modify it to allow for any favourable predicted winds, currents or hazardous ice floes.
If you’re crossing the Atlantic, American charts can be viewed for free at www.nauticalcharts.noaa.gov, but in remote areas, well away from shipping lanes, take care as some of the detail can be a bit sketchy.
A mate of mine was delivering a big yacht up the coast of South America and found an island ahead that wasn’t on his US chart. When he got home he checked on a British chart, and there it was!
Also on some Pacific charts, in areas of volcanic activity, there are notes saying ‘possible land’ and ‘broken water sighted’. Rumours also abound about islands with military bases being deliberately misplaced on charts, but I’m sure some of these were due to a different chart datum being brought in for GPS navigation.
Mind you, I have seen an order stating ‘charts must not be used for missile targeting, as only satellite imagery is accurate’ – so although most charts are great, a degree of scepticism makes sense.
Yachtsmen warned of navigational hazards following storms
The latest in a string of violent storms has left a trail of navigational hazards around damaged coastal regions
14 iPad and Android navigation apps tested
Gear test following an explosion in the number of marine navigation apps available for iPad and Android devices in the…
Tablet navigation – mount it safely
Why not mount it on the washboards?

Integrated navigation systems – RIN talk
Royal Institute of Navigation – Warsash tomorrow

Using a laptop for navigation on board?
Here's a way to use less power

Navigation by eye – what is a Kamal?
DIY sextant
How crazy are your navigation lights?
Crazed plastic reduces output of light