Dick Everitt assesses the differences between raster and vector charts when deciding on which chart plotter to buy

Even though we’re talking about electronic charts here, we still need a few paper ones for emergencies and planning, writes Dick Everitt.
Their sheer size makes it easier to get an overview, note alternate refuges and spot fiddly little details such as isolated rocks and overfalls.
We looked at the pros and cons of paper charts in a previous Nav in a Nutshell article, but as electronic ones are based on them any faults will have been copied across, and in the early days a few extra ones were added as well.
Unlike paper charts electronic ones are much easier to update – but there usually is another fee to pay.
Basically, there are two types of electronic charts, raster and vector – and it helps to understand the differences before deciding on which chartplotter to buy.
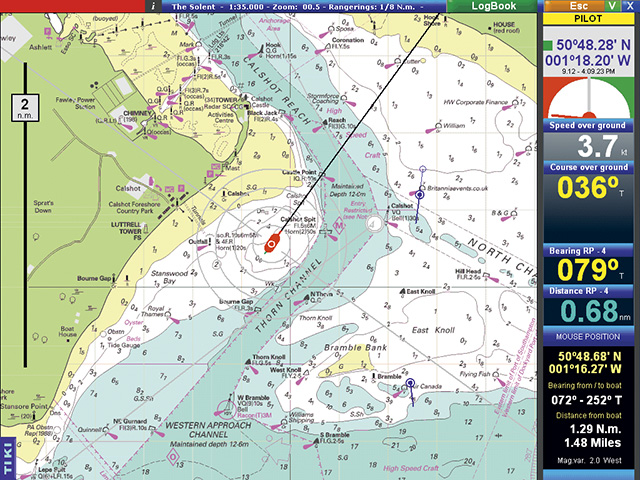
RASTER CHARTS are ‘pictures’ of paper ones
Raster charts
I imagine raster charts as being like ‘scans’ of the official Hydrographic Department paper charts, because they use the same symbols and their traditional appearance can’t be altered – although in reality it’s the other way around, with paper charts now produced from electronic data.
They can be displayed on PCs, so bigger screens are relatively cheap and modern laptops don’t seem to mind being at sea, provided they are kept dry. I’ve even seen some fishing boats with massive screens, mounted under a protective acrylic sheet.
The great thing about a chart plotter is there’s always a little symbol telling you where you are, no matter how rough it gets or how awful you feel. Another advantage is that it’s much quicker to create a route of waypoints – just move the cursor and click.
Transferring waypoints from a paper chart to a GPS takes skill though, and errors can creep in.
With a screen you must always keep zooming in to check the details, and a raster chart won’t de-clutter automatically, it’ll only enlarge everything – or offer to change to a more detailed chart.

VECTOR CHARTS are made up of layers that can be turned on or off
Vector charts
The other type of electronic charts are vector ones, which I visualise as being made up of layers of transparent sheets. Each layer holds different information that can be turned on and off as required, so if you are sailing in daylight the layer depicting lights can be turned off and you could simplify the screen by removing the very deep sounding marks.
Take care not to remove too much detail that might be useful later on: I once turned off a ship-turning zone to clear up some space on a small screen, and forgot it was there as we got close.
Radar, MARPA, AIS and DSC can all be displayed but some chart symbols are a bit different and may need an extra click to show their details in a pop-up menu.
All sorts of stuff lurks on different levels, ranging from tidal data and port information to the nearest Chinese restaurant. Vector charts can also be swung around to show head- or course-up with the lettering turned around to suit; handy if it’s orientated with a suitable radar picture.
They can also be used with a PC but many come on a memory card which feeds into a waterproof marine display that can be mounted near the helm.
You quickly get used to smallish screens, and when zooming in vector charts can de-clutter automatically – but a larger screen is better, especially if you need some of the space to display other information.
Alternatively, you might want to budget for two screens so you have a back-up, or de-clutter one while keeping extra stuff on the other.
ind you, some chart systems can be too clever. I don’t need a chart plotter to ‘fly up in the air’ and give 3D animated photos and charts, or ‘dive under the waves’ to see the contours of the seabed in perspective – but the occasional aerial photo is useful to get familiar with a new harbour before you enter it.
What about the future?
Some charts can be swapped between various devices and there’s talk of marking new wrecks by transmitting ‘virtual buoys’ that can only be seen on plotters.
But screen size matters – although a smartphone app is fine in an emergency, and their chart prices are amazing, the tiny screens are not ideal for serious navigation.
This Nav in a Nutshell was published in the November 2011 issue of PBO. For more useful archive articles explore the PBO copy shop.

Updating electronic charts
Despite the accuracy offered by digital charting, updating electronic charts is a complicated process. Here's how to keep your electronic…
Nav in a Nutshell: Clearing bearings
In the first of his series on back-to-basics navigation Dick Everitt explains how to use a few simple lines to…

Nav in a Nutshell: What is a transit and how are they used in navigation
Lining up a pair of appropriate land features or navigation marks can help keep you safe, as Dick Everitt explains

Nav in a Nutshell: Lighthouse characteristics on charts
Dick Everitt helps illuminate our understanding of lighthouse characteristics on charts, their dipping distances and loom...
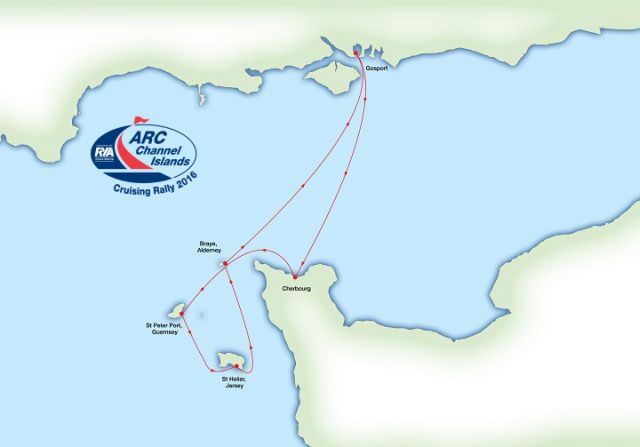
New ARC Channel Islands 2016 Rally – open for registration
More than 50 people gathered at the RYA lounge to learn more about the new ARC Channel Islands rally taking…

Nav in a nutshell: Looks good on paper
Up-to-date printed paper charts are a good bet for identifying your position – but they do have their limits, says…