
Back in the 1990s, I used a CAD package to regenerate the charts from a book I found in an Oxfam shop, writes PBO reader Nick Liddle.
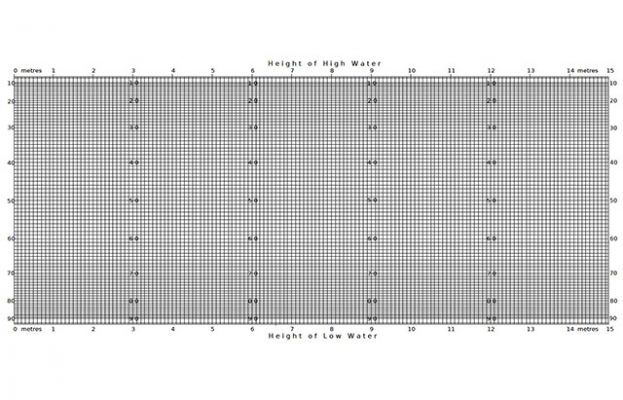
The book may have been an early edition of The Glénans Sailing Handbook – my favourite book at the time, which I no longer have. The charts assume a sinusoidal tide and produce intermediate heights and times based on that. The user prints the charts for single use or laminates them for multiple use, and then:
■ Join the height of high water and height of low water on chart 1 with a straight line, and…
■ Join the time of high water and time of low water on chart 2 with a straight line. A percentage can then be read off at the side of a chart for any given height (chart 1) or time (chart 2).
Transfer the percentage to the other chart and, hey presto, intermediate time for any height or height at any time, without calculation, within the limits of a sinusoidal tide height/time chart.
Height markings on chart 1 represent every 10cm, and time markings on chart 2 represent every five minutes.
A top tip sent in by PBO reader Nick Liddle
Click here to download the height of high water chart
Click here to download the time of high water chart
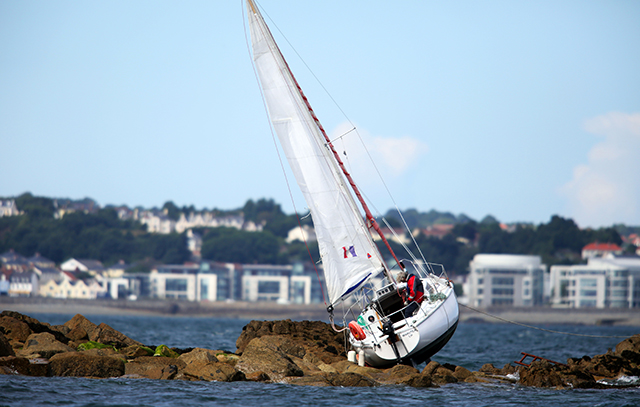
French yacht runs aground on Brehon Tower rocks
A French yacht grounded on Brehon Tower rocks between Guernsey and Herm.

How to work out tidal height calculation
PBO contributor Sticky Stapylton explains how to work out tidal heights for standard and secondary ports

Nav in a nutshell: Know tidal vectors
'It’s easy for any sailor to remember how to draw tidal vectors with a handy little aide-mémoire!' Says Dick Everitt.…
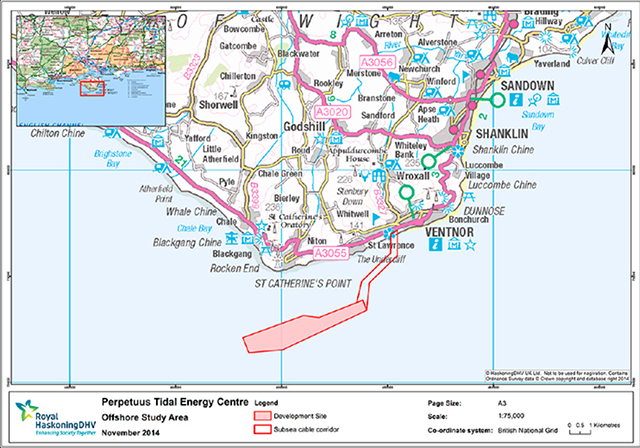
Grid-connected tidal energy centre approved
A state-of-the-art tidal energy generation project to be constructed off the Isle of Wight coast has been given approval.

Planning granted for Swansea Bay Tidal Lagoon
Planning permission has been granted for the Swansea Bay Tidal Lagoon, the world’s first tidal lagoon power plant.
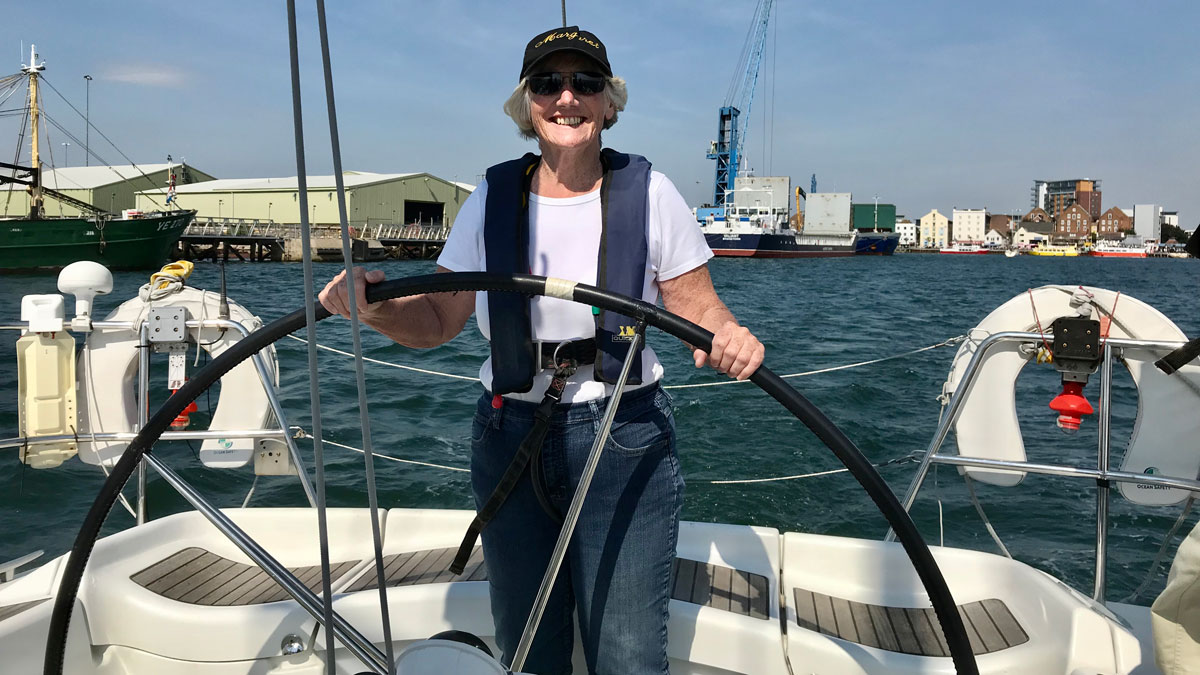
Becoming a Day Skipper
From classroom conundrums to night-time navigation, dinghy instructor Margaret Norris decides to give big boats a go
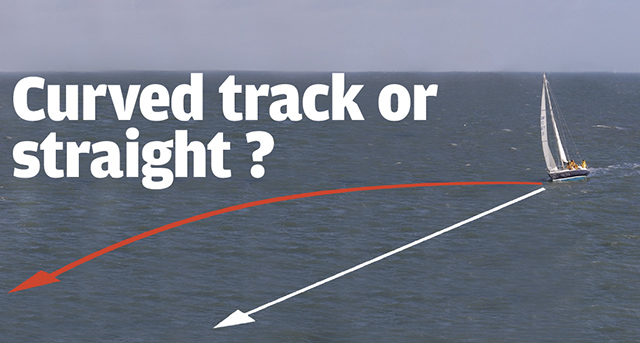
Nav in a nutshell: Curved track or straight?
GPS will keep us on the straight and narrow by constantly showing how much we need to adjust our heading…

Nav in a Nutshell: Navigate by ‘feel’ using an echo sounder
The ‘ping’ is king: You can navigate by ‘feel’ over the seabed in adverse conditions by using an echo sounder…

What to do when you run aground
Whether you go to sea under power or sail, you'll almost certainly find yourself aground at some point in your…
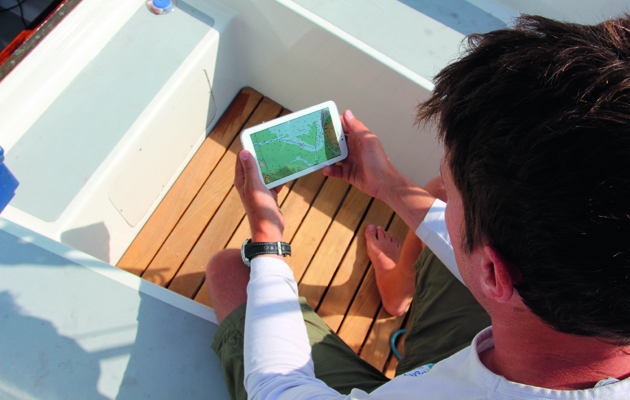
14 iPad and Android navigation apps tested
Gear test following an explosion in the number of marine navigation apps available for iPad and Android devices in the…

Should GMT be scrapped?
Parliament to vote on bill put forward by Conservative MP

Nav in a nutshell: Lee bowing defined
Dick Everitt explains how you can get a little lift from the tide

Dismasted yacht rescued of Norfolk coast
A dismasted yacht was rescued by the independent Caister Lifeboat charity service off the coast of Norfolk.