
In a bid to bring archaic navigation information into the 21st century, Bob Bradfield has been on a one-man crusade to update charts of Scottish anchorages

We’ve all heard the stories of Pacific reefs unsurveyed since Captain James Cook’s time, but many would be surprised to learn that some charts covering Scotland are based on surveys that are more than 150 years old.
This situation is one that sailor Bob Bradfield is keen to rectify. ‘Sadly, a substantial proportion of places yachtsmen want to visit on the West Coast do not benefit from large-scale charts, and many have not been resurveyed since the 1800s,’ he said. ‘In my opinion, if the best available chart shows too little detail to meet the needs of the user then, effectively, the area is “uncharted”’.
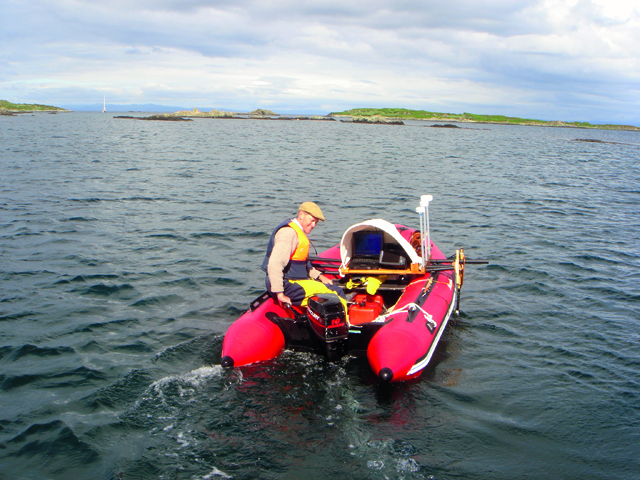
Bob’s fully kitted out survey inflatable
After he retired, Bob, who trained as an engineer, sailed his converted fishing schooner Antares around the UK. He found that many inshore areas in Scotland hadn’t been resurveyed since Admiral Henry Otter’s surveys between 1852 and 1863.
Yachtsmen can rely upon useful local pilotage guides like those published by the Clyde Cruising Club, which include plenty of local knowledge on aspects such as transits – but Bob couldn’t help feeling that there was a need for extra-large-scale electronic charts. ‘What if it’s dark or the fog comes down?’ he asks.
Starting in 2009, Bob set out to produce detailed surveys of some of the areas that were under-charted. Working originally from Antares and later from his new Nimbus 37 motorboat, Pegasus, Bob has to date carried out 134 detailed surveys of small-boat anchorages.
He surveys from a 3.8m inflatable tender, starting off using a single-beam depth-sounder in conjunction with a GPS with differential correction, which feed into his laptop via a data logger. He criss-crosses each anchorage to create a rough chart before returning to Pegasus to process the information, allowing for tidal height and atmospheric pressure via a portable tide gauge and pressure sensor. He identifies areas he may have missed, especially rocks and shallow patches, sometimes returning to resurvey them two or three times to verify the shape of any obstructions.
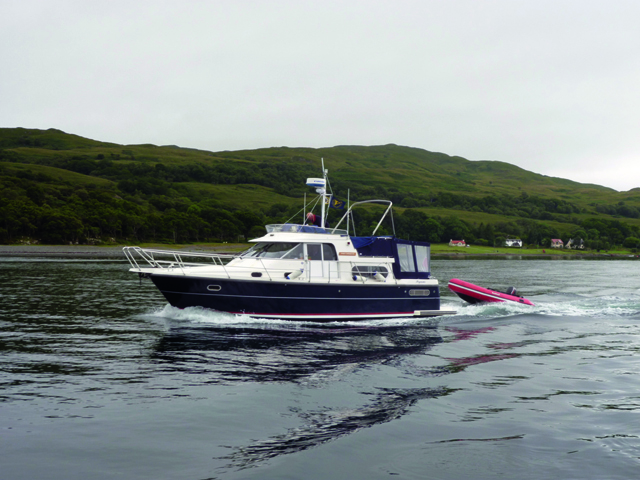
Bob’s current boat, Pegasus, underway with its surveying inflatable in tow
Sidescan sonar
With this done, Bob switches to a sidescan sonar and surveys the area again to double-check his chart. He compares the two surveys and, when happy he has all the data he needs, heads home.
The post-processing then begins, which turns the raw data into a readable chart with coloured depth shading. The computer software draws the chart by creating a TIN (Triangulated Irregular Network) model between selected soundings. Where there is lots of data it uses a small triangle size and draws very accurately.
With the chart drawn, Bob publishes the results, overlaid on an Ordnance Survey Open Data basemap to show land shapesand areas. This is a simplified explanation – the actual post-production process often takes far longer than the initial surveys.
‘It’s frightening what has been missed!’ Bob says of the official charts of the area, which are often in too small a scale to show sufficient detail for the cruising yachtsman.

LEFT The UKHO chart for Loch Don, with (RIGHT) Bob’s chart for the same area
Strictly unofficial
He is careful to describe his project as a hobby. ‘As an unqualified enthusiast with limited resources I can’t produce a comprehensive set of charts to rigorous standards, but I have made it my mission in retirement to do what I can: it’s great fun and seems to be meeting a need.’
Bob often surveys alone, with his wife or with friends, and has no plans to stop any time soon. He says he has been pleased with the reception to his charts, although he adds: ‘In doing my bit to rectify this situation I have been accused of “taking the danger and excitement out of yachting!”’
He sells all 134 charts on a CD or flash drive for £10.99 or £15.99 respectively.
‘I initially gave them away for free, but started charging to cover some of the production costs.
This doesn’t begin to cover the expenses involved in making them. ‘Luckily, we make the charts because we enjoy doing so!’
The charts are available in five software formats and three different projections to suit PCs and Macs, iPads and iPhones, Android phones and tablets, various Garmin handheld devices and other specialist devices. They will run on free plotting software, tablet apps, paid-for software with additional features and also as an overlay on Google Earth.

Bob’s chart for Loch Teacuis as it appears on an iPad
Officialdom’s view
‘We have a good relationship with the UK Hydrographic Office,’ says Bob, ‘which generally accepts our “notices” informing it of uncharted or misplaced rocks, wrecks and even the odd errant island.
‘It does not, of course, vet or approve our charts, which we share with experienced navigators but only after they have confirmed that they have understood the limitations and the manner in which the charts can be used, and are prepared to accept all associated risks.’
So where’s next for Bob? Depending on the weather, he hopes to head to the middle of the Outer Hebrides, the Monarch Islands, Coll and Tiree this year. He has a long list of other places in need of a survey, so it looks as though the next few years will be busy ones!
For more on Bob’s charts visit the Antares Charts website.